How we can supercharge our crops using their distant relatives
- Written by: Rajeev Varshney, Professor, Food Futures Institute, Murdoch University
Food security is shaping up as one of the biggest challenges we face globally. In some places, access to food has steadily deteriorated in recent years[1], due to wars, inflation and climate-driven extreme weather. The cost of basic foods such as eggs and vegetables has made news[2] worldwide.
Food price inflation is now ahead[3] of overall inflation in over half the world’s nations. The obvious answer is to grow more crops, especially the energy-dense top six[4] – rice, wheat, corn, potatoes, soybeans and sugarcane.
Unfortunately, it’s getting harder to produce food due to conflict, more extreme weather such as flash droughts and floods and a surge in plant diseases and pests[5].
For farmers to keep producing in an uncertain future, we need better crops. But much cutting edge agricultural research focuses on improving specific aspects of a plant – better drought resistance, or a better ability to tolerate salt in the soil. This may not be enough to cope with future shocks.
Our research[6] suggests a way to accelerate the creation of stronger crops by drawing on the full genetic strength of crop species.

Crops that don’t stop
Humans have greatly modified the plants which give us the lion’s share of our food, using tools such as selective breeding and genetic manipulation.
But much agricultural research is done in isolation. Researchers dive deep into solving specific problems – how to make wheat resilient against a specific fungus, for example.
The growing challenges to food security across many fronts means a new approach is needed. The changing climate will throw many different threats at our crops. Parts of the world might endure flash droughts while extreme rain floods others. Some pests and diseases will thrive in a hotter world.
That’s why we’re looking to another approach – pangenomics, which attempts to capture every gene a species has access to.
You might think a species has a unified set of genes, but this is not true. Yes, all rice plants have a set of shared genetic sequences. But individual plants and strains have distinct genetic differences too. The pangenome covers all of these.
The idea of a pangenome only emerged in 2005[7], when microbiologist Hervé Tettelin and his collaborators were looking for a vaccine against the streptococcus bacteria. As they examined different strains, they realised how much additional genetic information was held in them.
It was a breakthrough, and showed how much we missed by focusing closely on a single isolate of a species. Before their discovery, we had assumed an individual of a species carried enough information to accurately represent the genomic content of that species. But this isn’t correct.
This realisation has changed how we see our crops. Rather than trying to perfect a single cultivar (cultivated variety) using only its own genetic package, the pangenome offers a way to reinfuse lost vigour from the wider gene pool.
In 2019, we took the pangenome approach further by considering the entire gene pool[8] of a crop, including its domestic cultivars – and their wild relatives. Many wild relatives of domesticated crops still exist. These plants have huge genetic diversity, and often harbour superior genes or gene variants (alleles) lost to crop plants through domestication and breeding.
We dubbed this approach the “super-pangenome” to recognise the capture of domesticated and wild gene pools.
 Chickpeas are an important crop in India. International Crops Research Institute for the Semi-Arid Tropics, Author provided (no reuse)
How can this help shore up food supplies?
For more than 10,000 years, humans have domesticated and selectively bred crops. But wild relatives have thrived over the same timeframe.
There are good reasons these wild relatives have not been domesticated, from poor taste to difficulty of storage to low yields. But what they do have are desirable traits in their genetic code we can identify, isolate and infuse back into the domesticated species.
Once we have genetic data from across a species and its wild relatives, we can begin looking for particularly useful genes. What we’re after are the ones responsible for adapting to or surviving environmental stresses likely to get worse in the future, such as drought, saline soils and extreme temperatures. We can identify genes responsible for disease resistance and determine why certain varieties offer other desirable traits such as better taste or higher yields.
Around the world, a number of promising research projects use this approach, from American researchers using the genes of wild grapes to boost the yield of domesticated grapes[9] to Chinese researchers doing similar work on tomatoes[10].
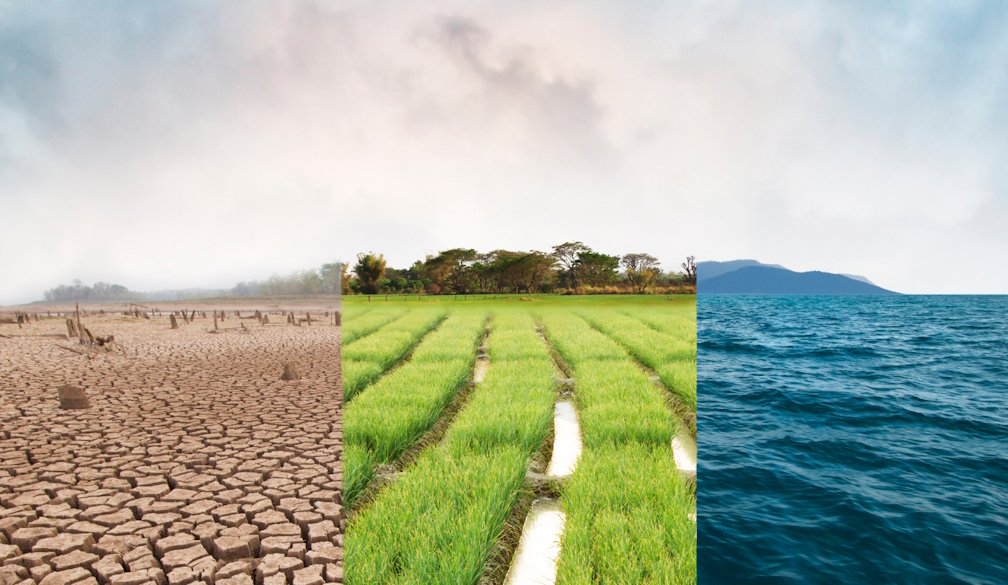
 How can we make crops more resilient to heat, drought and pests? KPixMining/Shutterstock[11]
We and our colleagues are focused on the humble chickpea[12], a highly nutritious legume of particular importance[13] to India’s 1.4 billion people. Chickpeas, like other legume crops, take nitrogen from the air and fix it in the soil, which improves fertility and helps offset emissions of nitrous oxide[14], a lesser-known greenhouse gas.
But chickpeas lack of genetic diversity due to several evolutionary bottlenecks, domestication and selective breeding. This is already causing problems, because low genetic diversity makes species more vulnerable to pests and disease. Chickpea farmers in Western Australia still remember the outbreak of a fungal blight[15] which almost wiped out production in the late 1990s and left the crop unpopular – even while other states expanded exports[16].
The solution: look to the wild relatives. In the genomes of relatives such as Cicer echinospermum[17], we found several promising genes[18] which helped resist this fungus.
These genes can now be incorporated into domesticated species through modern approaches – such as genomics-assisted breeding and gene editing – to develop disease-resistant and high-yielding chickpea varieties.
Once we seek out and capture the full gene stock of our most important crops, both wild and domesticated, it will become easier and faster to supercharge these essential plants – and equip them with the genes they need to survive the uncertainties the future holds.
References
- ^ recent years (impact.economist.com)
- ^ made news (www.carbonbrief.org)
- ^ now ahead (www.worldbank.org)
- ^ top six (www.telegraph.co.uk)
- ^ plant diseases and pests (www.economist.com)
- ^ research (www.nature.com)
- ^ in 2005 (pubmed.ncbi.nlm.nih.gov)
- ^ entire gene pool (pubmed.ncbi.nlm.nih.gov)
- ^ domesticated grapes (www.ucdavis.edu)
- ^ on tomatoes (www.nature.com)
- ^ KPixMining/Shutterstock (www.shutterstock.com)
- ^ humble chickpea (www.nature.com)
- ^ particular importance (worldpopulationreview.com)
- ^ nitrous oxide (www.abc.net.au)
- ^ fungal blight (agriculture.vic.gov.au)
- ^ expanded exports (www.abc.net.au)
- ^ Cicer echinospermum (powo.science.kew.org)
- ^ several promising genes (www.nature.com)