Sunny with a chance of sneezing – I'm building a tool to forecast pollen levels that will help allergy sufferers know when it's safe to go outside
- Written by: Fiona Lo, Postdoctoral Researcher in Environmental and Occupational Health Sciences, University of Washington
Do flowers blossoming in spring make you miserable? Are you sworn enemies with fall bloomers like ragweed? If you suffer from pollen allergies, imagine the usefulness of a reliable pollen forecast that could help you manage your symptoms by providing an early warning when pollen conditions are bad.
We’re working on it! As an atmospheric scientist, I study[1] the weather, climate and anything in our Earth’s atmosphere, including pollen. One in three people in the U.S. suffer from allergic rhinitis[2], otherwise known as “allergies,” and pollen is the most common cause.
While allergic rhinitis is not curable, its symptoms can be successfully treated. Two main methods are medication and pollen avoidance. They both rely on knowing when, where and how much pollen is, and is expected to be, in the air. Many medications work best if taken before symptoms occur. Advance knowledge of pollen allows allergy sufferers to change plans in order to minimize their exposure to pollen.
My colleagues and I are pulling together what we know about how plant biology and meteorology affect the amount of pollen in the air, along with pollen count numbers, to build a reliable pollen forecast.
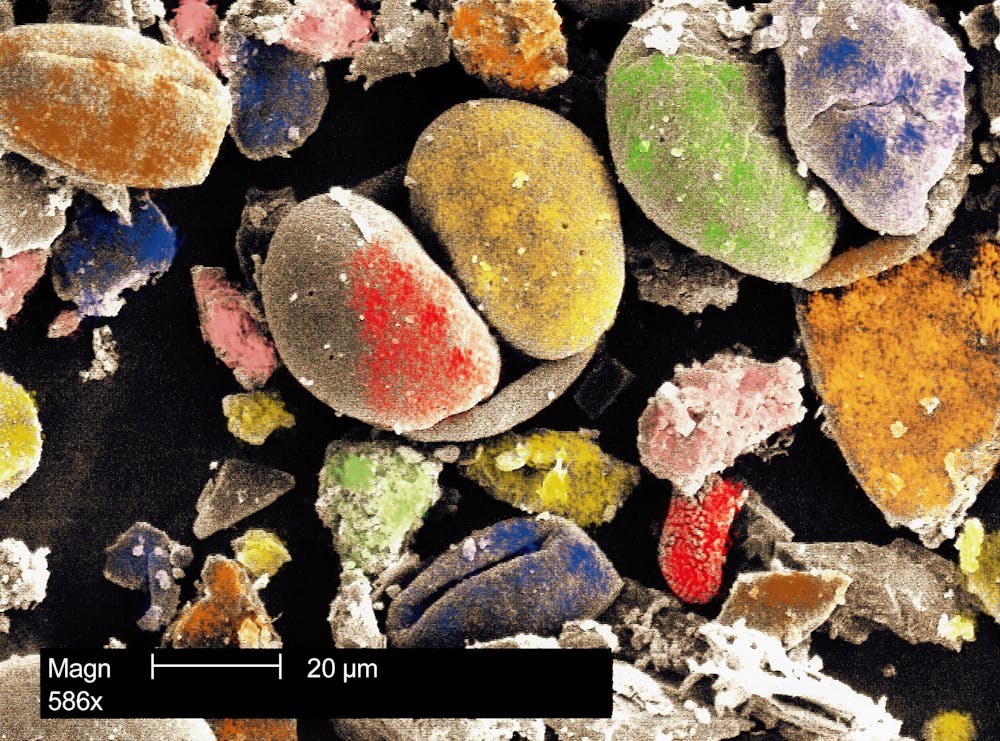 A view of pollen from various plants, magnified 586 times under the microscope.
BSIP/Universal Images Group via Getty Images[3]
A view of pollen from various plants, magnified 586 times under the microscope.
BSIP/Universal Images Group via Getty Images[3]
Counting pollen grain by grain
Allergic symptoms tend to be more severe the higher the concentration of airborne pollen. The amount of pollen in the air is constantly changing, so it would be ideal to monitor pollen in populated areas at regular frequent intervals. In the U.S., the National Allergy Bureau[4] collects, processes and distributes daily pollen concentrations from stations around the country.
Unfortunately, there are fewer than 90 active stations. Of these, many do not count on weekends or outside of the main pollen season. Part of the reason is that these are volunteer-run stations, and pollen monitoring requires significant time and resources.
Pollen is collected using a machine that sucks in air and traps pollen on sticky tape. A trained technician then processes, identifies and counts the tiny pollen grains under a microscope. During the height of pollen season, it may take a few hours for a technician to count the day’s pollen. Automated pollen monitoring systems do exist and would greatly reduce the need for human resources. But for now, these systems are either extremely expensive or have not been evaluated for accuracy.
Building a forecasting model
Pollen that causes allergic reactions is from anemophilous or wind-pollinated plants[5]. Pollen grains contain the male sperm from the plant[6], an essential component of plant reproduction. Anemophilous plants produce a lot of pollen because they rely on the whims of the wind to carry it to reach the female counterparts of their species to reproduce and grow new plants. The amount of pollen in the air has been rising because climate change is lengthening the pollen season[7] and increasing how much pollen gets produced.
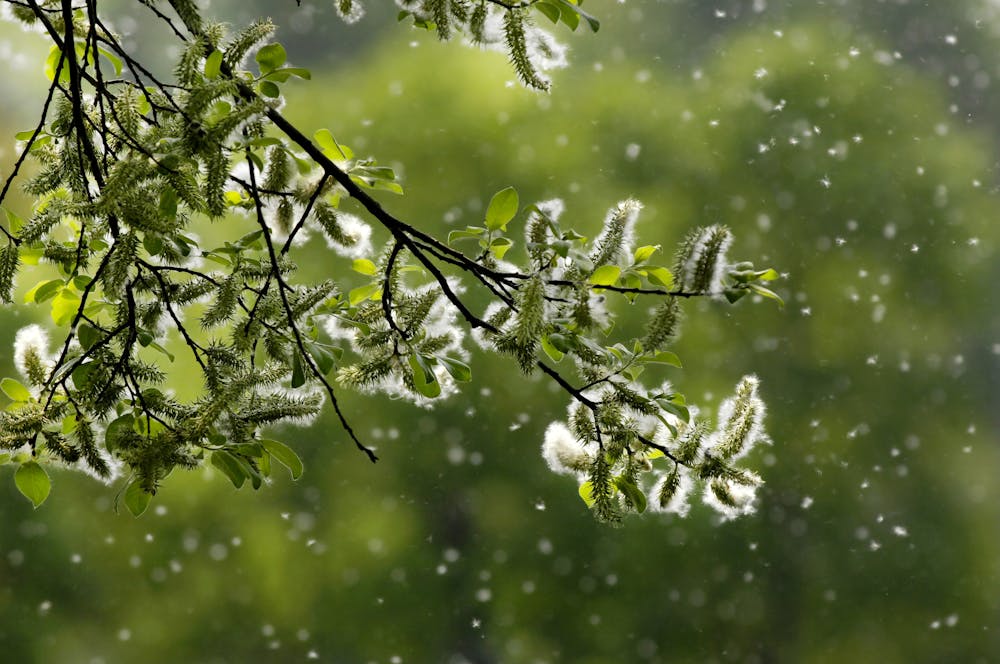 Certain weather conditions make it more likely to be a heavy pollen day.
Alkimson/iStock via Getty Images Plus[8]
Certain weather conditions make it more likely to be a heavy pollen day.
Alkimson/iStock via Getty Images Plus[8]
Since we have access to only a limited amount of pollen count data, my colleagues and I leverage what we know about the environment to estimate the amount of pollen in the air. Generally warm, sunny, dry and windy days are correlated with high airborne pollen concentrations, and rainy and humid days with low concentrations.
Plants depend on water and sunlight to grow. The timing of precipitation, temperature and solar radiation can affect a plant’s development and its readiness to flower. Once the plant is ready to flower, environmental variables can determine when pollen is released, how far it travels and how long it remains in the air.
The pollen model my colleagues and I have developed[9] uses these known relationships between meteorology and pollen to estimate airborne pollen. We also include satellite images of vegetation in the model because satellites can detect greening and provide an estimate of the beginning of spring.
Our model can forecast pollen 1 to 14 days in advance for locations where there are pollen stations. But due to the sparsity of pollen stations, we are working on extending the model to forecast in locations with no pollen counts. In those places we use nearby pollen station data, along with localized meteorology, to estimate the pollen.
Although pollen reporting and forecasts do exist in the popular media, their pollen reports differ from observations[10], and their forecasts are limited only to categories of trees, grasses and weeds. Our forecast can predict for specific pollen types because our model includes information about how each plant type interacts differently with the environment.
 Checking the pollen forecast could help you plan when to take allergy medication and how much time you’d spend outside.
Klaus Vedfelt/DigitalVision via Getty Images[11]
Checking the pollen forecast could help you plan when to take allergy medication and how much time you’d spend outside.
Klaus Vedfelt/DigitalVision via Getty Images[11]
A fine-tuned forecast in your pocket
We are collaborating with medical professionals and health scientists to understand the pollen levels associated with increasing severity of allergic symptoms. Our plan is to tailor the forecast to allow patients to better manage their symptoms.
So far, we can accurately forecast for four of the most abundant pollen types in the U.S. only in locations with pollen stations. We are seeking funding to expand to other pollen types and other locations, and we are working on creating a platform to automate the data processing and run the forecast.
Ultimately, we want to provide a forecast every day during pollen season to give allergy sufferers the information they need to manage their symptoms. Allergies are often undertreated[12] and knowledge about self-care is limited[13], so a reliable pollen forecast that is easy to access – for example via an app on your phone – along with education on allergy management, could really help allergy sufferers.
[You’re smart and curious about the world. So are The Conversation’s authors and editors. You can read us daily by subscribing to our newsletter[14].]
References
- ^ As an atmospheric scientist, I study (scholar.google.com)
- ^ suffer from allergic rhinitis (doi.org)
- ^ BSIP/Universal Images Group via Getty Images (www.gettyimages.com)
- ^ the National Allergy Bureau (pollen.aaaai.org)
- ^ anemophilous or wind-pollinated plants (sweetgum.nybg.org)
- ^ male sperm from the plant (pollen.utulsa.edu)
- ^ climate change is lengthening the pollen season (doi.org)
- ^ Alkimson/iStock via Getty Images Plus (www.gettyimages.com)
- ^ pollen model my colleagues and I have developed (doi.org)
- ^ their pollen reports differ from observations (doi.org)
- ^ Klaus Vedfelt/DigitalVision via Getty Images (www.gettyimages.com)
- ^ Allergies are often undertreated (doi.org)
- ^ knowledge about self-care is limited (doi.org)
- ^ You can read us daily by subscribing to our newsletter (theconversation.com)