New York City or Los Angeles? Where you live says a lot about what and when you tweet
- Written by: Mayank Kejriwal, Research Assistant Professor of Industrial & Systems Engineering, University of Southern California
The Big Apple versus The Big Orange. The City of Dreams versus The City of Angels. I’m referring, of course, to the ongoing rivalry[1] between New York City and Los Angeles. Hilarious “survey” videos[2] and talk shows[3] will give you one picture of the cities. My colleagues and I decided to take a more serious look at the differences between the cities, so we studied what everyone else was talking about – on Twitter.
We set out to answer a simple research question: Are people who are located near each other likely to tweet about similar things? To do so, we analyzed millions of GPS-enabled tweets[4] across New York City and LA. This type of study – looking at huge amounts of social media traffic by location – is useful for more than tracking pop culture memes in different cities. It could be valuable for understanding many aspects of urban life, including the effects of the COVID-19 pandemic.
If we were considering the case of a single, small community that takes pride in local events, celebrities and culture, the answer to our research question would be a resounding “yes.” One challenge in comparing two large, international cities is the reality that globalization has led to unprecedented interaction[5] among multiple cultures and peoples, along with Starbucks and McDonald’s seemingly in every city on the planet.
For cities that are international but also take pride in their uniqueness, the key is teasing out the extent to which local qualities or global culture dominate tweeting behavior. We designed our methods to be precise enough to account for the fact that, contrary to the fun videos, New York City and LA are quite similar. Both have high housing costs, famous educational institutions, hospitals, museums and other cultural establishments, and residents who tend to vote Democratic.
Define ‘close’ and ‘same’
Our study tackled two problems: There’s no simple definition of “close together,” and it’s difficult to say whether two tweets are about the same topic. We combined several definitions of “close together,” ranging from people located in the same city to the distance in miles between their coordinates, using a common formula[6] from spatial sciences.
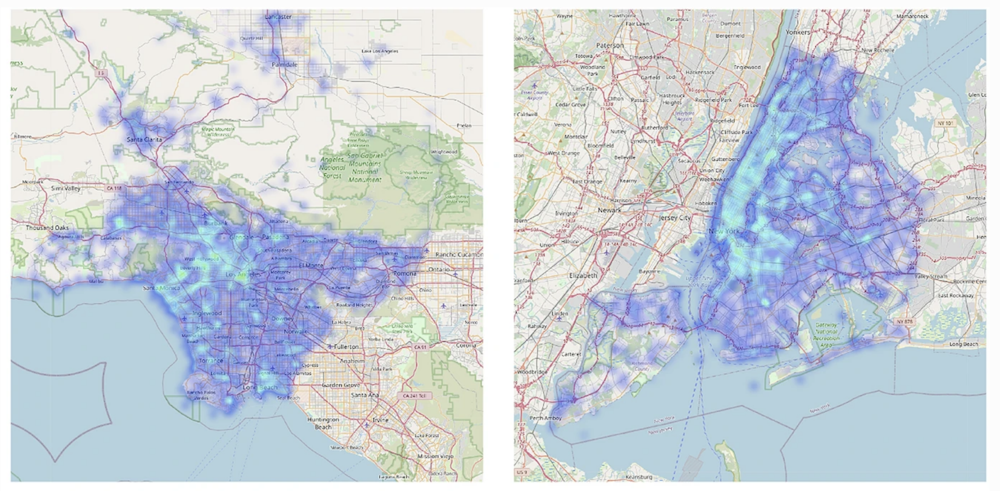 Tweeting in Los Angeles (left) and New York City (right). Blue indicates density of tweets; the brighter the blue the greater the number of tweets.
Minda Hu, CC BY-ND[7]
Tweeting in Los Angeles (left) and New York City (right). Blue indicates density of tweets; the brighter the blue the greater the number of tweets.
Minda Hu, CC BY-ND[7]
It’s more difficult to determine whether two tweets are talking about similar things. Looking for common hashtags might suffice, but unfortunately many people do not use hashtags or use different hashtags when talking about the same thing. To overcome this problem, we used state-of-the-art natural language processing[8] technology. Algorithms developed in this field read and interpret sentences in a manner similar to the way humans do, and they are able to deal with nuance.
We used this technology to group tweets into clusters of topics. We then studied whether tweets falling inside the same cluster were also from people who were close together based on their GPS-enabled tweets. This allowed us to determine, for example, that clusters containing art-related words and phrases tended to arise more often in New York than LA.
Health and wealth versus art and representing
Even before we looked at who tweets about what, we found tweeting across New York City to be more evenly spread, while in LA, more tweeting happens in wealthier areas, including Calabasas – home to Kim Kardashian[9] – Palos Verdes, West Hollywood and the coastal areas.
We also found that New Yorkers referred to themselves and their city far more often than Angelenos did. On a per capita basis, New Yorkers like to talk about art, while Angelenos like to talk about health care and hospitality.
LA generates more tweets than New York throughout the day, despite having a smaller population, but from 8 p.m. to 5 a.m. local time, the two have comparable numbers of tweets. Tweeting in New York City rises sharply from 8 p.m. to a peak at 9 p.m., whereas tweeting in LA rises steadily from 2 p.m. to a peak at 7 p.m.
Computational social science
Our methods are a case study in the growing field of computational social science[10], which aims to find insights in unique, often large, data sets using artificial intelligence models and algorithms. In contrast, traditional social science tends to rely on surveys and polls[11] to quantify public perception about an issue. Though surveys have some distinct statistical advantages, they can be expensive and time-consuming to use for collecting quality data with good response rates.
For example, Gallup releases new survey data every few months and currently charges US$30,000 for academic licenses[12]. Decades ago, researchers found that monetary incentives increase response rates significantly[13]. Even today, online surveys are often accompanied by lottery-based promises of receiving an Amazon gift card. Researchers are working on combining the benefits of traditional and computational social science[14].
Zooming into our data[15], we uncovered some fascinating trends that we hope future research will explore. We found, for example, that on a per capita basis, as crime increases, so do tweets, at least at the level of ZIP codes. Why do high-crime areas tweet more? We don’t know yet, but the trend is consistent across both New York City and LA.
Tweeting, place and COVID-19
Studying tweeting behavior by location could also be useful for understanding disparate outcomes of large-scale events. For example, our twitter analysis could help shed light on how the COVID-19 pandemic has affected people in different places.
New York City was hit hard by COVID-19 early on[16], showing that even major cities were affected in different ways by this terrible pandemic. New reporting[17] is now showing that even within cities, socioeconomically disadvantaged communities were disproportionately burdened.
Recently, we released a Twitter data set[18] covering 10 of the largest metropolitan areas in the United States to further study such disparities using computational social science. We are already using our methods across all of these cities to better understand how COVID-19 has affected certain groups, and the levels of expressed vaccine hesitancy among these groups.
Eventually, we hope to use our methods with a large set of international metropolises to study urban behavior.
[Get our best science, health and technology stories. Sign up for The Conversation’s science newsletter[19].]
References
- ^ ongoing rivalry (www.youtube.com)
- ^ Hilarious “survey” videos (www.youtube.com)
- ^ talk shows (www.youtube.com)
- ^ analyzed millions of GPS-enabled tweets (doi.org)
- ^ globalization has led to unprecedented interaction (books.google.com)
- ^ a common formula (www.igismap.com)
- ^ CC BY-ND (creativecommons.org)
- ^ natural language processing (doi.org)
- ^ home to Kim Kardashian (www.architecturaldigest.com)
- ^ computational social science (doi.org)
- ^ surveys and polls (www.pewresearch.org)
- ^ charges US$30,000 for academic licenses (aws.amazon.com)
- ^ monetary incentives increase response rates significantly (doi.org)
- ^ combining the benefits of traditional and computational social science (doi.org)
- ^ Zooming into our data (usc-isi-i2.github.io)
- ^ hit hard by COVID-19 early on (www.cdc.gov)
- ^ New reporting (www.latimes.com)
- ^ a Twitter data set (doi.org)
- ^ Sign up for The Conversation’s science newsletter (theconversation.com)