We used 1,000 historical photos to reconstruct Antarctic glaciers before a dramatic collapse
- Written by: Ryan North, PhD Researcher in Antarctic Geomorphology, University of Wollongong
In March 2002, the Larsen B Ice Shelf collapsed catastrophically, breaking up an area about one-sixth the size of Tasmania.
In a paper published today in Scientific Reports[1], we used nearly 1,000 film photographs of Antarctica from the 1960s to reconstruct exactly what five glaciers were like decades before the Larsen B Ice Shelf collapse. This allowed us to precisely calculate their contribution to sea-level rise.
Although Antarctica is far away, and changing conditions there may seem distant, the changes can have a profound effect for us all. The removal of an ice shelf[2] can cause glaciers to rapidly melt into the ocean and raise global sea levels.
After consecutive years of unusually warm temperatures, the Larsen B Ice Shelf collapsed over the course of a week. This induced dramatic change for the glaciers that used to flow into it. The glaciers have since been thoroughly monitored – but there were few observations of them before 2002.
However, an archive of more than 300,000 historical images contains an invaluable record of this area from 1968 and helped us measure the difference between then and now.

Observing glaciers
Ice shelves are thick floating bodies of ice attached to the coastline of Antarctica. The melting of an ice shelf does not directly cause sea-level rise.
However, ice shelves “hold back” the flow of glaciers. Once the shelves are removed, glaciers rapidly melt into the ocean. This transfers ice from the land to the ocean and causes sea-level rise.
To accurately predict how Antarctica’s glaciers will respond to future climate change, it is critical to understand how they have responded in the past. But some places in Antarctica are so remote, it is almost prohibitively difficult and expensive to get there and gather data.
Scientists often look to satellites to collect data because it is relatively cheap and easy. However, persistent cloud cover on the Antarctic Peninsula can interfere with satellite observations for most of the year.
This means that for many areas in Antarctica, observations are rare and often short-term.
Historical photographs are an invaluable record
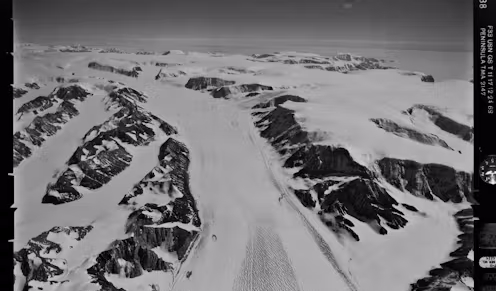
Between 1946 and 2000, United States Navy cartographers flew over almost every corner of Antarctica recording 330,000 high-quality, large-format film photographs in an effort to map the continent.
Scans of the photographs have been archived by the Polar Geospatial Center, University of Minnesota[3] and are available to freely download. These photographs are as high resolution as what many modern satellites can capture.
 Overlapping images of Crane Glacier in 1968. PGC, UMN
We created accurate and real-world scaled 3D models of five glaciers in the Larsen B area using a technique called photogrammetry. Traditional photogrammetry uses two overlapping photos from different angles to create a 3D surface – like how our two eyes can visualise objects in three dimensions.
Advances in computing now allow hundreds of overlapping photos to be combined with relative ease. Matching points in overlapping photos are detected automatically and their 3D position is calculated geometrically. An accurate glacier surface can then be made from a cloud of millions of matching points.
Identifiable features in the images with known coordinates, like nearby mountain peaks or uniquely shaped boulders, can then be assigned a GPS point to scale the model.
A virtual “flythrough” of Crane Glacier in 1968 which was affected by the 2002 collapse.Then and now
After comparing five glaciers in 1968 and 2001 (the latter just months before the collapse), we found they were relatively unchanged.
After the collapse, the glaciers lost 35 billion tons of land-based ice. From one large glacier, 28 billion tons was lost: equivalent to around 0.1 mm of global sea-level rise.
This doesn’t sound like much, but is the result of one glacier from one event. Put another way, it is equal to every single person on Earth tipping out a one litre water bottle every day for ten years.
These images were essential to observing the glaciers in high resolution decades before they were affected by the ice shelf collapse.
A new record of Antarctica
As climate change accelerates, warming of the atmosphere and ocean threatens the remaining ice shelves on the Antarctic Peninsula. The historical image archive will become increasingly important to extend the record of change and establish just how significantly things are changing.
The same images could be used to investigate other ice shelves or glaciers, changes to coastlines, penguin colonies, the expansion of vegetation, or even direct human impacts.
The historical image archive is a priceless resource waiting to be tapped.
References
- ^ Scientific Reports (doi.org)
- ^ removal of an ice shelf (theconversation.com)
- ^ Polar Geospatial Center, University of Minnesota (www.pgc.umn.edu)