Australia needs much more solar and wind power, but where are the best sites? We mapped them all
- Written by: Cheng Cheng, Research Officer, School of Engineering, Australian National University
Renewable energy’s share of Australia’s main electricity grid[1] has more than doubled from 16% to 35%[2] in five years, and the federal government wants this figure to reach 82% by 2030[3].
Nearly all new power plants in Australia are solar and wind[4] because these are the cheapest sources of electricity[5]. Some of the extra solar capacity will be on rooftops. However, most solar and wind farms will necessarily be in regional areas. So where are the best sites?
Our report, released today, set out to answer this question. We developed so-called “heat maps[6]” that identify which sites across Australia are – and are not – suitable for wind and solar projects.
The maps highlight the importance of being close to existing or planned high-voltage transmission lines. We hope our findings will empower communities, landholders, local councils when negotiating with renewable energy developers.
What makes a site suitable?
So what makes a site suitable for a renewable energy project? It depends on:
solar and wind resources – wind in particular can vary greatly from place to place, such as a windy ridge top versus a still valley bottom
access to high-voltage transmission[7] – the transformers, towers and cables that carry generated electricity to the cities
social, cultural and environmental constraints – urban areas, national parks and remnant native forest are unsuitable
aspect (ideally north-facing for solar) and slope (not too steep)
willing hosts – landholders host solar and wind farms and transmission lines[8] in return for large annual payments
social licence[9] – local community support in response to the economic activity and jobs that flow from constructing and maintaining solar and wind farms
government incentives or disincentives
access to roads, skilled workers and local electrical loads.
The two important siting factors that most often vary greatly from place to place within a region are access to the transmission network and to wind resources.
Access to transmission is the largest constraint. Typical power lines cross dozens to hundreds of properties and require complex negotiations with many people.
In contrast, solar and wind farms generally fit on one or a few properties. That usually makes an access agreement much easier to negotiate.
Read more: What is the electricity transmission system, and why does it need fixing?[10]
A closer look at the heat maps
Our high-resolution heat maps[11] identify the solar and wind potential of all prospective areas close to existing or approved high-power transmission.
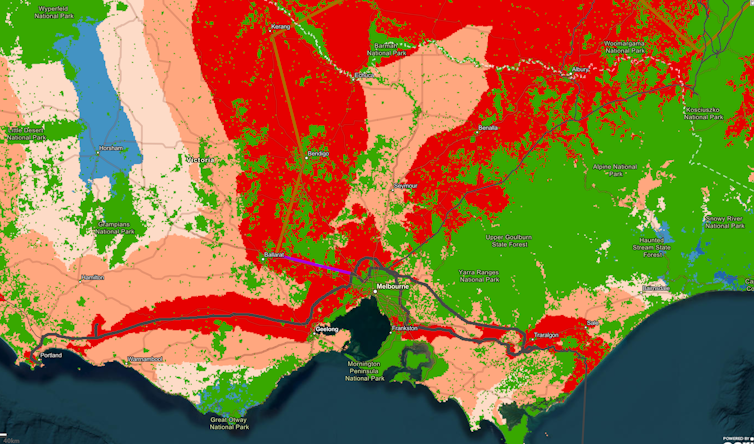
Pixels in the map are red if a location scores well. Yellow and blue pixels indicate less preferred locations. Green pixels are unsuitable land such as conservation reserves, urban regions and native forests.
The pixels are 1km by 1km for solar and 250m by 250m for wind, because the wind resource varies more rapidly with location.
Users can zoom and pan with ease. Clicking on a pixel obtains an indicative relative cost of generating solar or wind electricity (in A$/MWh) for that location. It includes the cost of energy from a solar or wind farm plus the cost of a low-voltage powerline to the nearest existing or planned high-voltage transmission lines.
Read more: Renewables need land – and lots of it. That poses tricky questions for regional Australia[12]

It doesn’t include costs for environmental and geotechnical approvals, road upgrades, substations, payments to host farmers, risk and others. These costs vary greatly with the scale of the project. To include these costs, heat-map users can select high, medium or low-range costs.
All existing and planned transmission lines with voltage of 275kV or above are included. These include anticipated or actionable projects discussed in the Australian Energy Market Operator’s 2022 Integrated System Plan[14]. We added two scenarios for 220kV lines in Tasmania in order to include the Battery of the Nation[15] hydropower project.
We modelled 12 scenarios[16]: six each for solar and wind. The scenarios cover high, medium and low-cost assumptions, with overhead or underground low-voltage powerline connection to the transmission network. Going underground increases the cost by six times.
Landholders might be able to negotiate a substantial annual access fee for overhead powerlines to the transmission network, to allow developers to avoid the costs of going underground. Hybrid overhead-underground powerlines might sometimes be an attractive compromise.
Solar and wind generation within each pixel is assigned to one of five cost classes: A, B, C, D and E. The lower-cost A, B and C classes are strongly preferred.
For each local government area in Australia, we estimated potential solar and wind capacities for the five different cost classes. The renewable resource that can be used will depend on local transmission line capacity and local loads. We can provide detailed information to local councils.
Read more: Up to 90% of electricity from solar and wind the cheapest option by 2030: CSIRO analysis[17]
There’s no shortage of suitable sites
Class A, B and C sites are all close to existing and planned high-voltage transmission. This consideration outranks excellence of local solar and wind resources. Landholders in Class A/B/C regions can negotiate attractive terms to host solar and wind farms and powerline connections to transmission networks.
A particularly attractive region for solar and wind farms in NSW is the Goulburn-Lithgow district. It’s well served by transmission and has good wind and solar resources.
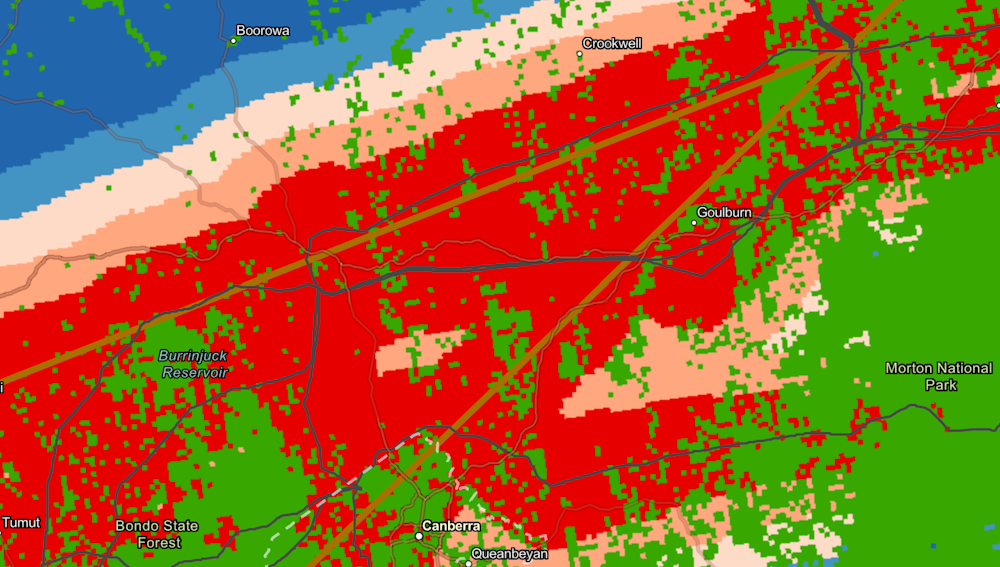 Heat map around Goulburn for the scenario with underground power lines and low solar costs.
RE100 Group, Author provided[18]
Heat map around Goulburn for the scenario with underground power lines and low solar costs.
RE100 Group, Author provided[18]
In Victoria, the Yallourn district is attractive because of good wind potential and strong existing transmission into Melbourne, plus there’s a need to replace local coal industry jobs. There’s also extensive wind potential west of Melbourne, good solar potential in the state’s north and extensive offshore wind resources in Bass Strait.
South Australia has excellent wind and solar potential to the east of St Vincent and Spencer gulfs.
Queensland’s best wind and solar sites follow the coastal transmission lines north from Brisbane.
Good wind and solar sites in Western Australia follow the transmission lines north and south of Perth.
Tasmania has extensive wind resources along the north coast, on King and Flinders islands and in Bass Strait. Their development depends on the Marinus Link[19] being constructed across Bass Strait.
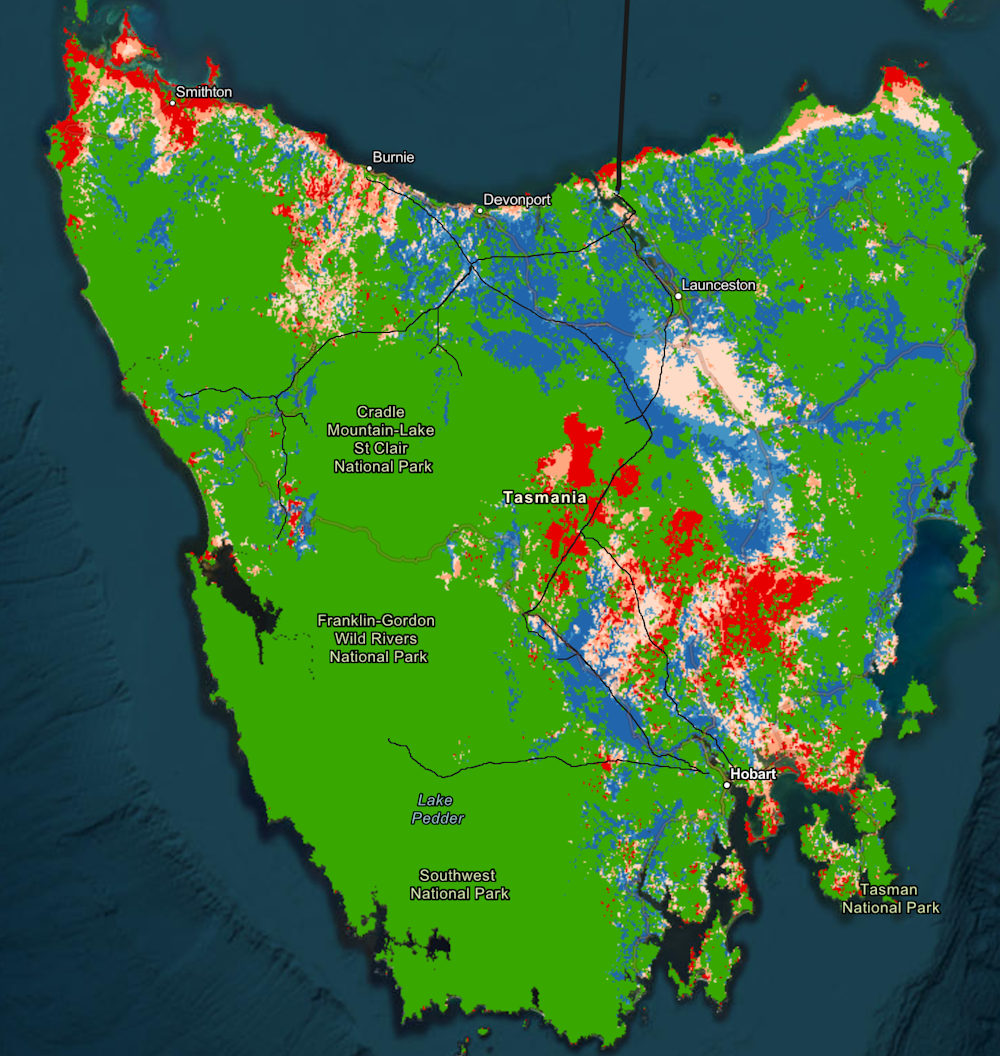 Tasmanian sites for wind under the low-cost scenario with overhead powerlines.
Read more: There's a huge surge in solar production under way – and Australia could show the world how to use it[20]
Who’ll benefit from these maps?
Solar and wind farm developers have extensive information and experience in evaluating locations. This creates a large imbalance in knowledge when they negotiate with landholders, communities and governments.
By empowering local councils and landholders to identify suitable sites, our heat maps will help reduce this imbalance.
Developers might benefit, too, if the maps reduce the complexity and time involved in gaining legal access and community acceptance.
Local governments can also use these maps to identify potential zones for multiple solar and wind farms. These renewable energy zones[21], which are recognised by the states, could help attract developers, boosting local economic activity.
The authors gratefully acknowledge funding support for this research from CWP Renewables and Innovation Connections.
References
- ^ main electricity grid (aemo.com.au)
- ^ 16% to 35% (opennem.org.au)
- ^ 82% by 2030 (reneweconomy.com.au)
- ^ solar and wind (www.cleanenergyregulator.gov.au)
- ^ cheapest sources of electricity (www.iea.org)
- ^ heat maps (re100.eng.anu.edu.au)
- ^ high-voltage transmission (theconversation.com)
- ^ transmission lines (reneweconomy.com.au)
- ^ social licence (theconversation.com)
- ^ What is the electricity transmission system, and why does it need fixing? (theconversation.com)
- ^ high-resolution heat maps (re100.eng.anu.edu.au)
- ^ Renewables need land – and lots of it. That poses tricky questions for regional Australia (theconversation.com)
- ^ RE100 Group (www.arcgis.com)
- ^ Integrated System Plan (aemo.com.au)
- ^ Battery of the Nation (www.hydro.com.au)
- ^ 12 scenarios (re100.eng.anu.edu.au)
- ^ Up to 90% of electricity from solar and wind the cheapest option by 2030: CSIRO analysis (theconversation.com)
- ^ RE100 Group (www.arcgis.com)
- ^ Marinus Link (www.marinuslink.com.au)
- ^ There's a huge surge in solar production under way – and Australia could show the world how to use it (theconversation.com)
- ^ renewable energy zones (www.climatecouncil.org.au)