Outer suburbs' housing cost advantage vanishes when you add in transport – it needs to be part of the affordability debate
- Written by: Neil G Sipe, Honorary Professor of Planning, The University of Queensland
In all the debate about Australia’s housing crisis, the impact of transport has been largely overlooked.
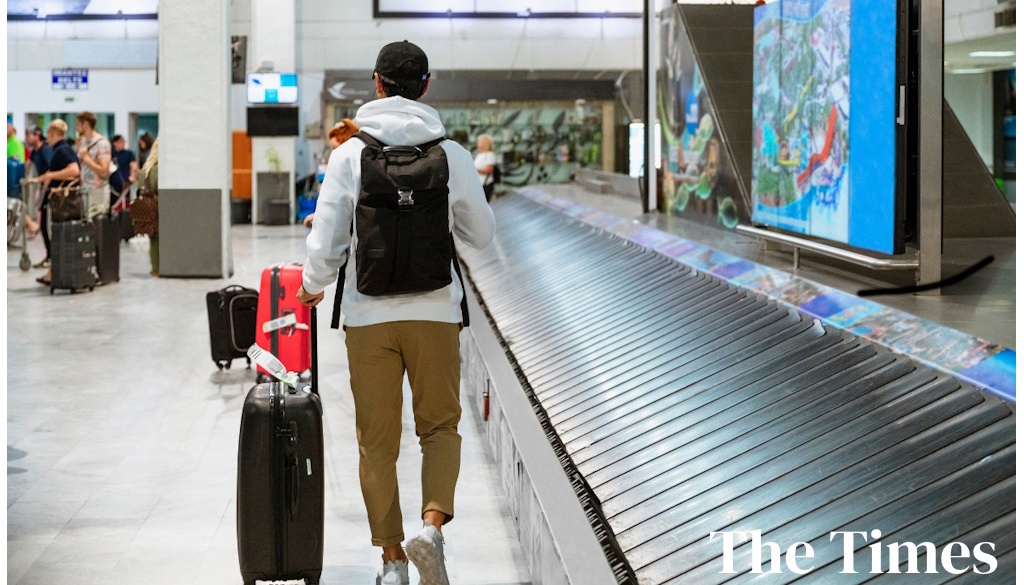
When we talk about transport, it’s usually about time spent commuting[1] and not the out-of-pocket costs. While housing is typically the biggest household cost, spending on transport is the second- or third-largest cost[2] – and these costs are inextricably linked.
There is research[3] to suggest the cost difference between the inner and outer suburbs largely vanishes when both housing and transport costs are taken into account.
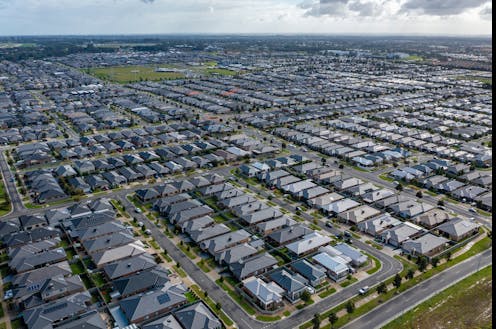
In Australian cities, housing costs typically decrease with distance from the CBD. Thus, people looking for affordable housing tend to look in the outer suburbs.
The desire to own a home, and reap the benefits of increasing housing values, trumps all other considerations. Would-be buyers typically consider the house price and not the commuting costs. That’s because the home price is a single known figure, while transport costs add up over time.
But when housing and transport costs are combined, the “cheaper housing” in the outer suburbs becomes more expensive as their residents typically travel longer distances. These extra transport costs leave households facing mortgage stress in these outer suburbs in an even worse situation.
Read more: Affordable housing is not just about the purchase price[4]
The high cost of car-dependent suburbs
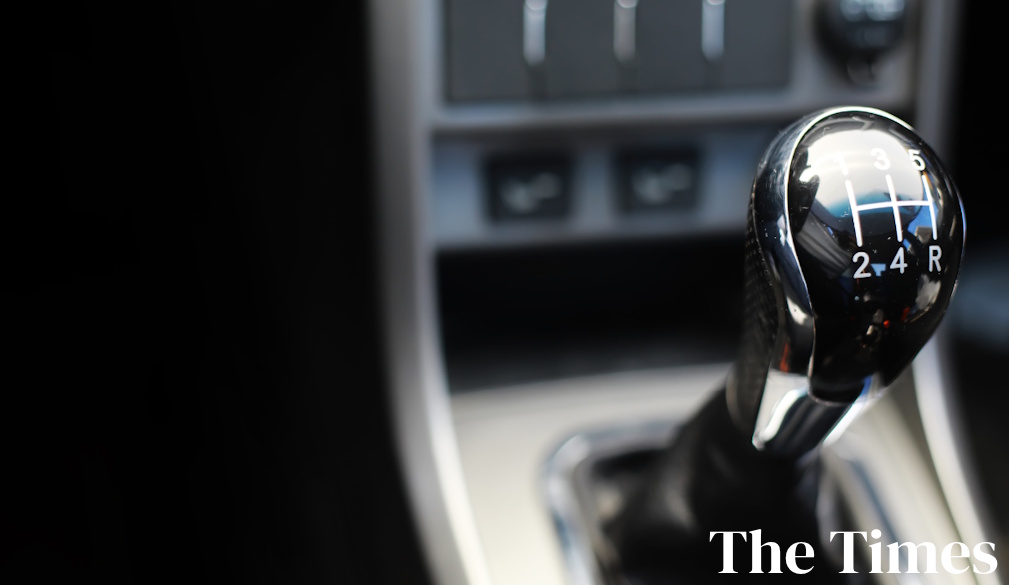
How much does it cost to run a car? Using Australian Tax Office[5] and Australian Bureau of Statistics[6] data, the annual cost for households with one vehicle is around $9,500 per year, or nearly $800 a month.
However, many households, particularly in the outer suburbs, have more than one car. Their costs could be twice as much, or more if they drive longer-than-average distances.
When combined with the national average monthly mortgage repayment of $3,425 to $3,535[7] as of April (before the last two interest rate rises), this means driving costs could increase the average cost of owning a suburban home by nearly a quarter (for one-car households) to a half (for two-car households).
Concerns about the transport impacts of housing decisions are not new. In 2006, urban policy researcher Jago Dodson[8] and I developed the VAMPIRE (Vulnerability Assessment for Mortgage and Petroleum Inflation Risks and Expenditure) Index[9] to examine household vulnerability to higher mortgage interest rates and fuel costs. It showed the outer suburbs of Australia’s capital cities were the most vulnerable because they depended on motor vehicles (not public transport) to get around.
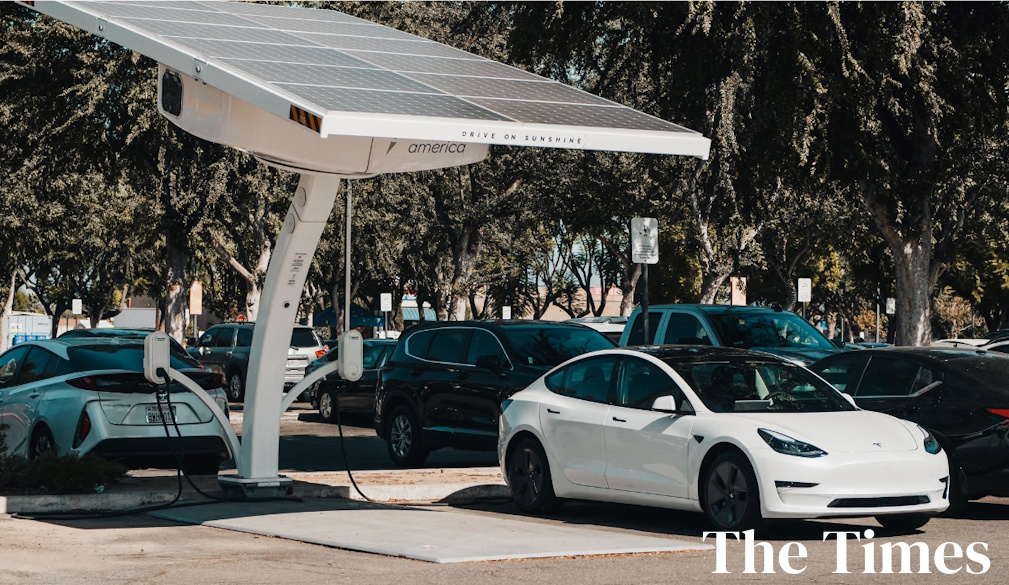
One goal of our research was to help improve public transport in outer suburban areas. Residents would then be less reliant on car ownership and ultimately less vulnerable to interest rate and fuel price increases.
Policymakers showed considerable interest at the time. However, such concerns seem to have dissipated over the years – although urban transport researcher Abraham Leung[10] updated[11] the VAMPIRE Index for southeast Queensland last year.
Related Australian research includes a 2020 analysis[12] of the impacts of commuting costs on housing affordability for low-income renters.
Read more: Designing suburbs to cut car use closes gaps in health and wealth[13]
Why not consider housing and transport costs together?
The idea of combining housing and transport costs is not widespread. Yet notable efforts have been made, particularly in North America, to provide a more accurate picture of the true costs of buying a house in particular areas.
The most impressive effort has been the work done by the Chicago-based Center for Neighborhood Technology. It created an H+T (housing plus transportation) Index in 2006. This index examines costs for all parts of the US[14] and is regularly updated. It provides a better understanding of the affordability of each area by dividing housing and transport costs by income.
Another national-level example is the US Department of Transportation’s Housing and Transportation Affordability Indicator[15]. It measures what the average US household spends on housing and transport combined as a percentage of income.
One of the most advanced efforts at a local and regional government level is the work of the metro Vancouver region in Canada.
This study[16] found that when housing and transport costs are both taken into account, there is little cost difference between the inner and outer suburbs. Thus, prospective home owners would be better off looking for housing closer to the CBD. Vancouver includes housing and transport costs in its Metro 2040 Plan[17].
Another regional government example comes from Portland, Oregon. The city has created an equity atlas[18] that shows the combined cost burden of housing and transport.
Read more: Living 'liveable': this is what residents have to say about life on the urban fringe[19]
What does this mean for planning policy in Australia?
Housing strategies must consider transport when deciding land-use plans and where to develop new housing estates. This more holistic approach would produce better outcomes by reducing cost pressures on households.
Such an approach would likely result in higher housing densities closer to the CBD and other employment centres. It should also get decision-makers to focus more on providing better public transport for outer suburbs and other areas that lack good transport services.
One obstacle to an integrated approach by Australian policymakers is that they lack a way to easily assess the combined housing and transport costs. While the VAMPIRE index was a step in the right direction, Australia needs a regularly updated and more focused tool like the above-mentioned H+T Index and Housing and Transportation Affordability Indicator.
References
- ^ time spent commuting (www.smh.com.au)
- ^ second- or third-largest cost (www.abs.gov.au)
- ^ research (www.metrovancouver.org)
- ^ Affordable housing is not just about the purchase price (theconversation.com)
- ^ Australian Tax Office (www.ato.gov.au)
- ^ Australian Bureau of Statistics (www.abs.gov.au)
- ^ $3,425 to $3,535 (www.canstar.com.au)
- ^ Jago Dodson (theconversation.com)
- ^ VAMPIRE (Vulnerability Assessment for Mortgage and Petroleum Inflation Risks and Expenditure) Index (www.researchgate.net)
- ^ Abraham Leung (theconversation.com)
- ^ updated (radiata.app.carto.com)
- ^ 2020 analysis (www.ahuri.edu.au)
- ^ Designing suburbs to cut car use closes gaps in health and wealth (theconversation.com)
- ^ all parts of the US (htaindex.cnt.org)
- ^ Housing and Transportation Affordability Indicator (www.transportation.gov)
- ^ This study (www.metrovancouver.org)
- ^ Metro 2040 Plan (www.metrovancouver.org)
- ^ equity atlas (equityatlas.org)
- ^ Living 'liveable': this is what residents have to say about life on the urban fringe (theconversation.com)