Be suspicious of claims the mining industry creates non-mining jobs
- Written by John Hawkins, Senior Lecturer, Canberra School of Politics, Economics and Society and NATSEM, University of Canberra
Emblematic of the sort of claims that put the “con” into economics was an assertion by the Queensland Resources Council[1] last year that “the resources sector employs 372,000 Queenslanders”.
The number employed in mining was 66,000, but the council claimed to have used input-output tables in the Australian National Accounts to add to that a much larger of “indirect” jobs created by mining.
It led to the awkward conclusion that mining contributed almost 46,000 full-time jobs to the electorate of McConnel, which had 40,000 enrolled voters.
The credulous way some of the media report such claims partly explains why the public has an inflated idea of the importance of the mining sector.
Surveyed Australians think coal mining makes up 9.4%[2] of the workforce. The true figure at the time was 0.4% — or around 48,200 workers nationally as of May 2020.
The claims derive from a lesser known part of the Australian National Accounts[3], the ones that tell us each quarter whether or the economy has grown or whether we are in recession.
It comes out once a year, almost two full years after the calender year to which it refers.
 Drilling down.
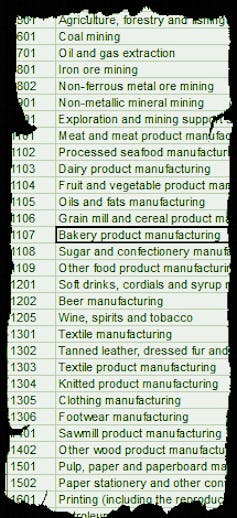
ABS Input Output tables[4]
How much value is baked in?
Known as the input-output tables[5], it’s a honeypot for consultants because it paints an incredibly detailed picture of the ways in which each part of the economy interacts with each other.
As an example, the most recent (which came out last month) tells us the value of bakery products manufactured was A$8.2 billion.
To make these baked goods, the industry used $900 million of grains and cereals, $700 million of meat (fillings for pies), and $500 million of sugar and confectionery (icing for cakes).
It paid $200 million to transport the goods, $100 million to clean the factories and so on.
This added up to $5.2 billion in payments to other industries.
The difference between the $8.2 billion and the $5.2 billion represents the “value added” by baking manufacturers.
Employees in the industry were paid $2.6 billion and there were $200 million in profits for the investors.
Australia also imported another $1.9 billion of bakery products.
The input-output tables reveal a lot
The tables also show what happened to all these bakery products. $1 billion went to restaurants and $1.5 billion to other industries. $6.8 billion were bought by households, $800 million were exported.
Importantly, the input-output tables enable comparisons. The industries providing the most full-time equivalent jobs are retailing, professional services and health. The industries making the largest profits are finance and iron ore and oil and gas extraction.
In mining, the profits paid out are ten times what’s paid out in wages. In most manufacturing and service industries more is paid out in wages than profits.
What the tables cannot do is tell us how many jobs an industry has “created” outside of the industry itself.
Listen to the statistician
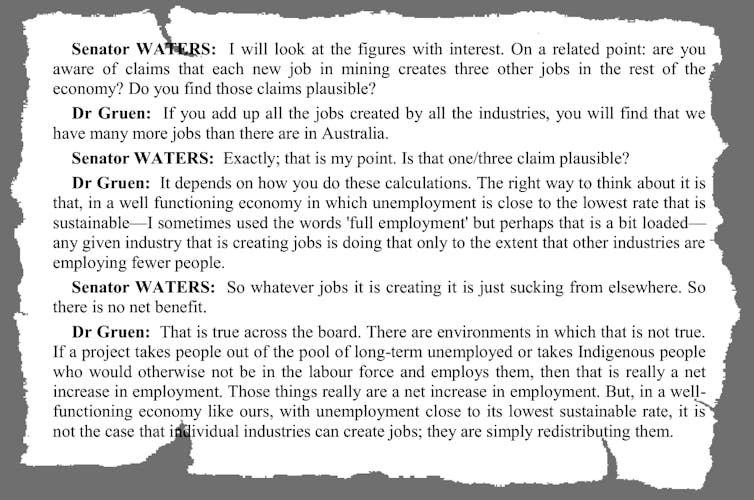
A few years back, a senior treasury official called out this practice, as the following extract from a Senate committee hearing shows:
If you add up all the jobs “created” by all the industries, you will find that we have many more jobs than there are in Australia […] In a well functioning economy any given industry that is creating jobs is doing that only to the extent that other industries are employing fewer people.
That official was David Gruen.
 Senate Economics Legislation Committee, February 16, 2012[6]
David Gruen is now head of the Australian Bureau of Statistics. Not only does the bureau no longer publish “multipliers” that allow spurious claims to jobs created to be easily calculated, under his leadership it now publishes a very prominent warning[7]:
The most significant limitation of economic impact analysis using multipliers is the implicit assumption that the economy has no supply–side constraints. That is, it is assumed that extra output can be produced in one area without taking resources away from other activities, thus overstating economic impacts.
It concedes that users “can compile their own multipliers as they see fit”.
They shouldn’t, and we should be suspicious when they do.
References
- ^ Queensland Resources Council (www.theguardian.com)
- ^ 9.4% (australiainstitute.org.au)
- ^ Australian National Accounts (www.abs.gov.au)
- ^ ABS Input Output tables (www.abs.gov.au)
- ^ input-output tables (www.abs.gov.au)
- ^ Senate Economics Legislation Committee, February 16, 2012 (parlinfo.aph.gov.au)
- ^ warning (www.abs.gov.au)


