Australia's 'carbon budget' assessment reveals astonishing boom and bust cycles
- Written by: Yohanna Villalobos, Postdoctoral research fellow, Lund University
If you really want to know how much Australia contributes to the amount of carbon dioxide (CO₂) in the atmosphere, you have to study all the “sources” and “sinks”.
Sources release CO₂ into the atmosphere, while sinks take it out. There are sources from human activities, such as burning fossil fuels, and there are natural sinks such as plants absorbing CO₂. You can tally it all up on a balance sheet to find the net result. Are we adding to CO₂ levels in the atmosphere, overall? And if so, by how much?
It’s an enormous undertaking, but not impossible. We have just published the most comprehensive assessment[1] of Australian CO₂ sources and sinks. It covers the decade from 2010 to 2019, and it reveals some surprising features.
Astonishingly, we found the net annual carbon balance of the entire continent switches from year to year. Australia can be a large net source of CO₂ one year and a large net CO₂ sink the next, in response to our increasingly variable climate. That makes it harder to detect long-term trends and understand whether our natural carbon sinks are growing or decreasing.
Read more: Fossil CO₂ emissions hit record high yet again in 2023[2]
What is the contemporary carbon budget?
Our research reveals what we call the “contemporary carbon budget” for Australia.
This budget is different from the “remaining carbon budget[3]”, which refers to the CO₂ that can still be emitted before we exceed a certain level of warming.
We constructed the contemporary budget using a wide variety of data and modelling approaches. We needed to estimate the carbon “fluxes” (sources and sinks) of land-based ecosystems, freshwater bodies, and of human activities such as the combustion of fossil fuels and changes in land clearing and revegetation.
We also used global assessments, Australia’s National Greenhouse Gas Inventory[4], and trade statistics[5]. And we used atmospheric and satellite CO₂ information to help determine the Australian carbon balance, as well as other satellite-based data to estimate Australia’s fire emissions.
We developed this carbon budget with the best available data and scientific tools. However, large uncertainties such as data gaps and model limitations remain for some of the estimates. We report all uncertainties in the research paper[6].

Carbon in, carbon out
The biggest CO₂ source from Australia’s human activities is fossil fuels, with an average of 403 million tonnes of CO₂ for the decade 2010-19. That can be broken down into coal (44%), oil (34%), gas (18%), gas flaring (3%) and cement (1%).
Emissions from wildfires (natural) and prescribed burning (human-caused) were 568 million tonnes of CO₂ a year which, unlike fossil fuels, are largely offset by subsequent vegetation regrowth. This led to a net CO₂ accumulation in the atmosphere of 36 million tonnes a year. CO₂ emissions from the Black Summer fires in 2019 were exceptionally high at 951 million tonnes, much of which has already returned to vegetation after three years of above-average rainfall.
Rivers, lakes and reservoirs – both natural and human-made – are also sources of CO₂, contributing 82 million tonnes.
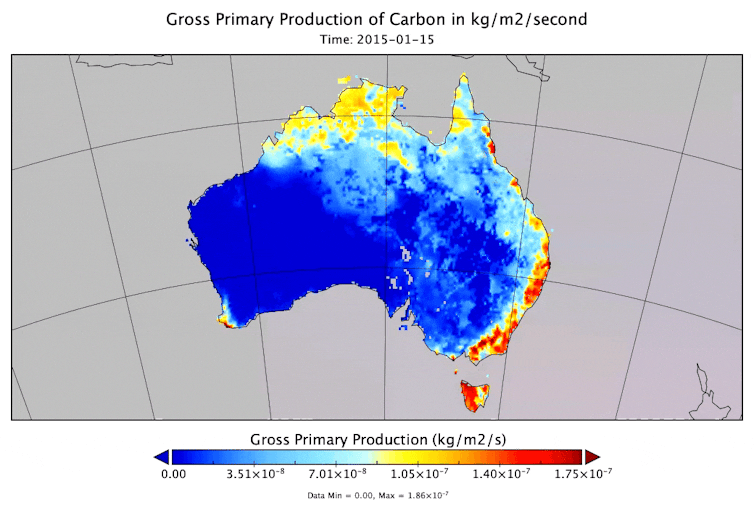
Natural forests, savannas and the large expanses of rangelands all contributed to removing vast amounts of CO₂ from the atmosphere at a rate of more than 388 million tonnes a year.
Coastal ecosystems “blue carbon” such as mangroves, tidal marshes and seagrasses soaked up 61 million tonnes of CO₂ a year, further adding to Australia’s CO₂ sinks. However, estuaries, including tidal systems, deltas and lagoons, released 27 million tonnes of CO₂ into the atmosphere.
The oceans surrounding Australia are also strong CO₂ sinks, removing about 183 million tonnes of CO₂ a year. This highlights the important role of the oceans, in addition to the land sink, in slowing the buildup of atmospheric CO₂ due to human emissions.
Exported carbon
Every year, about 1 billion tonnes of CO₂ are exported in the form of fossil fuels, primarily coal and natural gas.
A further 22 million tonnes of embedded CO₂ are exported every year in products such as wheat, wood pellets and livestock.
When these exported fossil fuels and products are consumed overseas, they release their carbon content into the atmosphere as CO₂.
However, the UN Framework Convention on Climate Change[7] and rules supporting the Paris Agreement[8] only require nations to report emissions released from their own territory. Emissions from exports are counted by the countries where the fossil fuels and products are eventually consumed.
The flip-flop carbon dynamics
We have long known about the “boom and bust” dynamics of Australia’s vegetation growth as it responds to periods of above-average rainfall and drought.
But we never imagined the entire nation could flip-flop so quickly from being a very strong and globally significant CO₂ sink, as in the La Niña of 2010-11[11], to being a major source of CO₂. But that’s precisely what happened as drought and fire changed the carbon accounts of Australia, during the southeast drought of 2018-19 and the following Black Summer fires in 2019.
Read more: A staggering 1.8 million hectares burned in 'high-severity' fires during Australia's Black Summer[12]
What this tells us about the path to net zero
When we put all of the land-based CO₂ sources and sinks together, overall Australia was a net source to the atmosphere of 200 million tonnes of CO₂ a year during 2010-19. This drops to 140 million tonnes of CO₂ a year if we count the sinks from coastal ecosystems.
This means CO₂ sinks are partially offsetting fossil fuel emissions. This is something we have also estimated at the global scale, where about one-third[13] of global fossil fuel emissions are removed by terrestrial land-based CO₂ sinks.
While this highlights the important role natural CO₂ sinks play in slowing climate change, it does not imply we have less work to do to reach the net zero emissions target.
That is because natural CO₂ sinks are already accounted[14] for in estimates of the remaining carbon budgets and decarbonisation pathways to stabilise the climate. Accordingly, the Paris Agreement calls for achieving a balance between anthropogenic emissions and removals by sinks of greenhouse gases, the so-called net zero target.
The large year-to-year variability of Australia’s non-anthropogenic carbon dynamics also underscores the need for a comprehensive and long-term monitoring and modelling observatory system to track the evolution of sources and sinks. We need high quality data supplementing the National Greenhouse Accounts to support decisions around how to use Australia’s natural assets to mitigate climate change.
Read more: Carbon removal is needed to achieve net zero but has its own climate risks[15]
References
- ^ most comprehensive assessment (agupubs.onlinelibrary.wiley.com)
- ^ Fossil CO₂ emissions hit record high yet again in 2023 (theconversation.com)
- ^ remaining carbon budget (www.nature.com)
- ^ Australia’s National Greenhouse Gas Inventory (www.dcceew.gov.au)
- ^ trade statistics (www.industry.gov.au)
- ^ research paper (agupubs.onlinelibrary.wiley.com)
- ^ UN Framework Convention on Climate Change (unfccc.int)
- ^ Paris Agreement (www.un.org)
- ^ Data supplied by author (agupubs.onlinelibrary.wiley.com)
- ^ CC BY-SA (creativecommons.org)
- ^ in the La Niña of 2010-11 (theconversation.com)
- ^ A staggering 1.8 million hectares burned in 'high-severity' fires during Australia's Black Summer (theconversation.com)
- ^ about one-third (globalcarbonbudget.org)
- ^ are already accounted (www.carbonbrief.org)
- ^ Carbon removal is needed to achieve net zero but has its own climate risks (theconversation.com)