6 graphs that explain today’s CPI
- Written by: John Hawkins, Senior Lecturer, Canberra School of Politics, Economics and Society, University of Canberra
 BagzhanSadvakassov/Upsplash, CC BY-SA
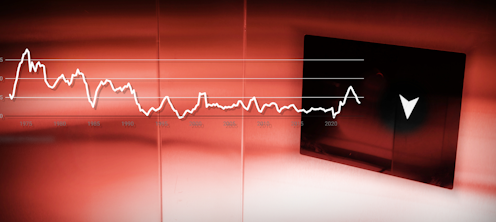
Australia’s inflation rate has fallen for the fifth successive quarter, and it’s now less than half of what it was back in late 2022.
The annual rate peaked at 7.8% in the December quarter of 2022 and is now just 3.6%, in the March quarter figures released on Wednesday, leaving it within spitting...